
How much mobility is there?
Mobility Rates Out of Low-Wage Work in the U.S.

This post presents figures from my 2019 article on low-wage workers’ mobility published in The Russell Sage Foundation Journal for the Social Sciences (open access).
It is one of the small tyrannies of the structure of academic disciplines that we often lack basic, up-to-date descriptive data on social phenomenon of interest. Innovation is highly-prized in these spaces. At least in my corner of the woods in sociology, this means researchers focus on trying to conduct studies that change other researchers’ minds. As a result, research designs that solve the puzzles created by previous work, test or challenge theories, and make substantial methodological improvements are the name of the game. (I highly recommend Ezra Zuckerman Sivan’s essay On Genre on framing articles; check-out his new podcast Outsider/Insider and his substack Sociological Imaginaries while you are at it).
Now in the economic mobility space, there are regular reports from government agencies using cross-sectional data. For example, we know a lot about the unemployment rate from the Current Population Survey and the Federal Reserve Economic Data (FRED) platform has made this and other labor market time series data previously buried in reports more accessible. Similarly, the Census Bureau produces annual reports on poverty and many other topics. Yet, as far as I know, government agencies are not producing regular reports using longitudinal data on intragenerational mobility (let me know if I’ve missed them!). As I wrote last week, when we think of economic mobility, the valance is towards the bottom of the economic hierarchy and so our interest is in low-wage work and poverty. Check out the time trends for these categories and a discussion of their (lack of) overlap.
We can think about the production of these cross-sectional statistics as the “knowledge infrastructure” we use to monitor trends and create stylized facts related to economic mobility (see Dan Hirschman’s 2021 article in American Journal of Sociology; unpaywalled version). The reality that the most likely data anyone will come across on low-wage work and poverty is cross-sectional could give the impression that there is a lack of mobility and that these are groups of people, rather than statistical aggregates. The next section is a excursus on this topic, if you want to data skip to the last section.
Statistical Aggregates and Groups
A statistical aggregate is a set of individuals who all happen to be at the sample place or placed in the same category by a researcher. For example, the people standing at a bus stop (yes, I know most of you haven’t ridden the bus since elementary school; so maybe standing in line at airport security better fits your social class experience). Now what makes an aggregate a group? Some kind of shared experience. The durability of the group is related to the intensity and duration of the experience and the social, relational, and organizational infrastructure needed to sustain the group bonds. To return to the bus stop, if there is a car accident in front of the bus stop and the people standing there leap into action to pull people out of their cars, call 911, comfort each other, etc. maybe group bonds would form. All the more so if some of the same people find themselves at the bus stop again another day and ended up as witnesses in a court case. (This is the kind of story my preschooler is fond of coming up with).
There is a large literature on how social identities are formed, particularly race/ethnic identities in the context of migration, interaction with the state, and markets. For example, DuBois’ (1903) in the Souls of Black Folk writes about the shared experience of “double consciousness” as the key to understanding Black/African-American identity. Patterson’s (1975) case study of diverging trajectories of race/ethnic social identification among Chinese immigrants on two different Caribbean islands with different social and economic conditions. Colson’s (1953) ethnographic study of the Makah Indians and her finding that the stipulations in the treat with the U.S. government hardened identity boundaries that were looser and more diffuse prior contact by white settlers and government intervention.
My point is that we should be careful about treating statistical aggregates as group identities. The measurement to create the categories of low-wage work and poverty are statistical exercises. We can’t be sure of the degree of shared experience in a statistical aggregate. We also can’t be sure people placed in the same category identify with or recognize each other, which is a key element of groups.
If you dig into the writing on the measurement of low-wage work and poverty categories, you will rapidly find that there is a significant lack of agreement among researchers about the thresholds and exclusion criteria. Who is in and who is out – boundary management – is a key part of group formation. Government statistical reports matter in that they shape government programmatic action and access. Participating in the same government program may lead to constituencies and group identity. But we shouldn’t confuse how the government use of statistical categories programmatically can create groups form the statistical exercise of categorizing people.
Our understanding of economic mobility is anchored in “folk” categories and images that haunt our interpretation of data and trends. For example, the poverty literature is dominated by the image of the Black, urban single mother as in Ronald Reagan’s rhetoric about “welfare queens”. An under told part of the story of this rhetoric is that it was a response to the organizing of welfare clients led by Black women in the late 1960s and 1970s that culminated at its peak in the National Welfare Rights Organization (NWRO). The traditional image of the low-wage workers is the fast food worker explored in Newman’s (2006) book Chutes and Ladders and other workers in the low-end service jobs, like child care workers and home health aides.
I am taking this detour through the concept of aggregates and groups because I think the interpretation of descriptive quantitative data is particularly susceptible to the lenses we bring to the data. What did we expect to find? What do we think we know? What are the limits of what we can learn from this data? What information are we bringing to the data that is facilitating our interpretation? I am a fan of slowing down. Many reports, blog posts, let alone academic journal article are full of charts and figures. Less is more, if we have a fuller understanding.
Mobility Out of Low-Wage Work
In my 2019 article, I use the Panel Study of Income Dynamics (PSID), a national-representative longitudinal survey of the U.S., to ask how much mobility there is out of low-wage work. The primary focus of the paper is trying to understand whether the amount of mobility has changed since the 1970s. For my dissertation, I analyzed mobility in Germany and also have analyses I conducted for Denmark. We will save the story of variation across time and countries for another day.
The PSID is the right dataset for this question because the sample, selected in 1968 (with some sample additions along the way), includes people of all ages. This is quite different than the other main U.S. longitudinal survey, National Longitudinal Survey of Youth (NLSY), that follows a birth cohort of people of a similar age at the start of the survey over their whole lives (see my posts on workers’ careers). So, while the NLSY is intended to represent the people in the birth cohort, the PSID is intended to represent the whole U.S. population.
Now, if we anchor on our folk notions of low-wage work, we might not be thinking of the whole U.S. population, or all people working in low-wage in any given point in time. This makes the question of who are we talking about becomes important. For this analysis, I am showing you the mobility for people age 25 to 54 who were observed entering low-wages (from unemployment or better wages). I then follow them until they are observed working for better wages, defined as wages above the low-wage threshold. The threshold I am using defines low-wages relative to the median wage in that year. Low-wage work is defined as working for less than 2/3rds of the median hourly wage for full-time workers or about $14 an hour in 2021 dollars for the 2015 threshold.
If workers become unemployed for more than 4 months they come back around to zero when they start their next low-wage job. The reason for this is people are most “at risk” of moving out of low-wages when they have a job and work continuously. In the analysis, the time spent unemployed continues to accrue between employment spells and the negative impact of unemployment on future mobility is captured by this measure in the analysis.
Figure A1 shows the predicted cumulative mobility out of low-wage work. The numbers from this figure comes from a kind of regression analysis (called event history analysis) that I use in the article. The x-axis is the measure of time (years since starting the current low-wage employment spell). The y-axis is cumulative mobility meaning it adds up people who moved to better wages in each year. People may fall back into low-wages and return to the analysis. As we saw in the two work histories from the NLSY79, people’s wages do move around, but they are mostly stable outside of job changes and unemployment spells incorporated into the analysis.
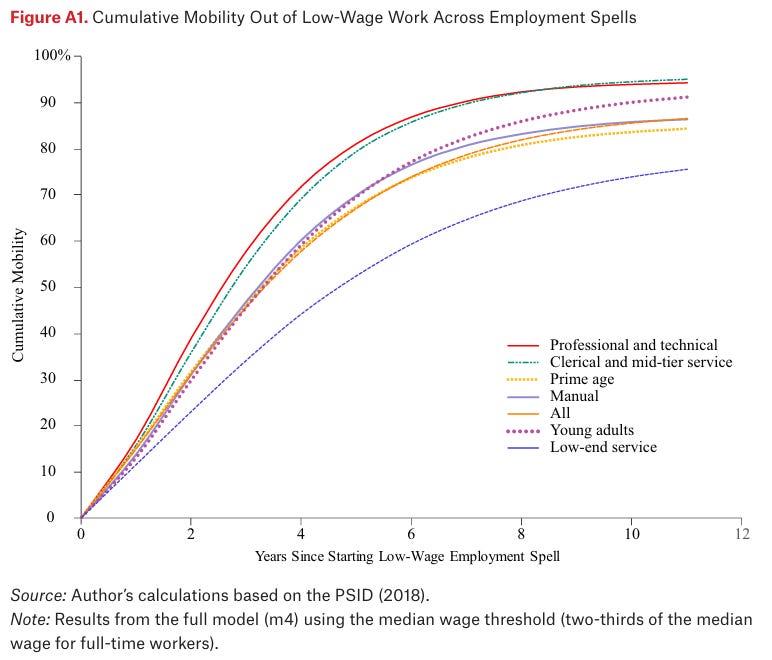
Looking at Figure A1, the line for all workers is orange and hidden in the middle grouping of lines. About 31% of all low-wage workers move to better wages in 2 years, 58% in 4 years, and 74% in 6 years. As the steepness of the curves show, most of the mobility is occurring between 2 and 4 years since starting a low-wage job. How low-wage workers achieve mobility is a question I take on it in a more recent article. Read about the topline results in this post.
About 15 percent of all entrants into low-wage work don’t obtain better wages after being continuously employed for most of the year for 9 or 10 years. We might be interested in this set of workers as a highly-disadvantaged group. These workers in long low-wage work spells were not the focus of analysis in the article, but we can get a sense of the likely characteristics associated with these workers by looking at the characteristics with negative effects on mobility (see Figure A2 in the article). Workers with more employer or firm changes, more time spent unemployed, and lower levels of educational attainment, particularly less than a high school degree are much less likely to move out of low-wages. These are work experiences that do not lead to career continuity. Women and people from non-white race/ethnicities likely overrepresented among those who are not upwardly mobile after 10 years.
The figure has separate lines for low-wage workers who are young adults (25 to 34; dotted pink) and of prime age (35 to 54; yellow). These lines hug the line for all workers indicating that age category is not a major differentiator for mobility.
What jumps off the figure is the occupational differences between low-end service workers (dashed dark purple line) on the low-end and professional & technical workers (red) and clerical workers (green) on the high-end. Workers in manual jobs (solid light purple) are in the middle near the line for all workers (orange). About 39% of professional & technical workers achieve better wages in 2 years, 72% in 4 years, and 87% in 6 years. The long-term set of professional & technical workers employed in long low-wage spells settles in at 5 percent. The rates are similar for clerical and mid-tier service workers.
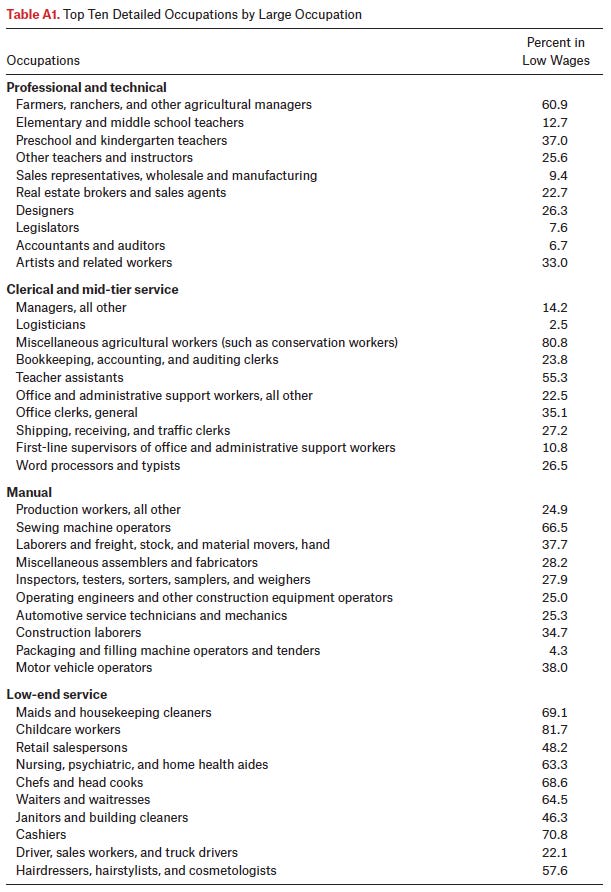
Professional & technical workers are about 10% of all low-wage workers, while clerical workers are about 22%. Table A1 shows to the top 10 detailed occupations within each larger grouping over the whole period from 1968 to 2015. So, some of these occupations may reflect the past and not the present. It is important to note that there is significant variation in the share of workers in these detailed occupations that are in low-wages. Most workers in these occupations are not in low-wages – a finding I write about when describing a similar table on detailed low-wage occupations using more recent and larger dataset from the Current Population Survey.
Notable professional & technical workers which have a high share of 4-year BA degree holders include K12 teachers (lots of state variation in teacher pay), real estate brokers and sales agents, and designers. Low-wages in these last two occupations may reflect commission and self-employment aspects of those jobs. Bookkeepers, officer clerks, and word processors and typists are in the top 10 low-wage occupations for clerical and mid-tier service worker. Among the top manual occupations (about 30% of all low-wage workers) are production workers, freight and stock movers, and automotive service technicians.
In contrast, low-end service workers are about half of all low-wage workers and have much lower rates of mobility out of low-wage work. Only about 23% have moved to better wages in 2 years (8% lower than average), 44% in 4 years (14% lower), and 59% in 6 years (14% lower). A full 25% of low-end service workers have not exited low-wage work after mostly continuous employment for 10 years. The workers in low-end service jobs are cleaners, child care workers, retail workers, cashiers, and home health aides which are the prototypical low-wage jobs.
In this article, I categorize all low-end service workers together, which may they share a similar experience (are they a group?). In more recent work, my co-authors and I look at mobility using detailed low-wage occupations. We find substantial variation in 1-year occupation and wage mobility rates among detailed occupations in the Current Population Survey among occupations I group into the low-end service category. For example, 9.5% of child care workers in low-wage moves to better wages in 1-year, while 14.3% of retail salespersons do.
There is something true about the folk image of low-wage workers. Low-end service workers have lower rates of upward mobility. Even so, there is substantial mobility for workers in these jobs and many or most workers in these jobs do not work for low wages. Recognizing the variation in jobs and worker characteristics among low-wage workers is useful for clarifying which policy questions are most pressing and which policy levers can affect the outcomes of interest in the short and long-term.