
Two Work Lives in the NLSY79
Telling Stories with Longitudinal Data

This post is the second post in a series drawing from my article with Arne Kalleberg and Ted Mouw (UNC-Chapel Hill) published in the peer-reviewed journal Social Science Research in 2025. Read the whole article. The first post introduces the NLSY79 data and answers the question, “How many careers do people have over their work lives?”
The entry point for studying work from a sociological perspective is to talk with people about their jobs. Consequently, theory in sociology is commonly grounded in a qualitative and ethnographic tradition. What quantitative sociology is attempting to do is to take quantitative data and match it up with what’ve heard from workers to see how well it fits the story and contextualize the story in a broader context.

The longitudinal data we have in the NLSY79 is by definition quantitative (read more about the NLSY79 in the first post). Respondents are asked questions on an annual survey and their responses are coded into variables (think the columns on an Excel spreadsheet with people on the rows). Most of what quantitative researchers do in regression analysis is a more complicated form of correlation: if column b with the worker’s educational attainment has a 1 (less than a high school degree), how well can we predict their wages in column c?
Economists typically have a much different entry point than sociologists. They are more like philosophers with their thought experiments. For example, there is the philosophical thought experiment called the Trolley problem of whether to sacrifice one person to save many that is central to utilitarianism. Economists thought experiments are naturally about how the economy works and include the operation of markets and firm decision-making to why workers invest in education. Then, like analytic philosophers who turn to math and created formal logic models, economists turn to math and create models of the relationship between variables that correspond to the thought experiments.
There is tremendous utility in economic modeling. As in philosophy, analyzing a thought experiment from all angles and considering different cases has led to major insights that are not intuitive or weren’t intuitive at the time. (A problem with major breakthroughs in science is they become common knowledge and then part of our intuition. The existence of germs and DNA are good examples.) All of this is to say that when we speak of quantitative analyses as “econometrics” we are invoking how economists typically use quantitative data: namely, to test their thought experiments with empirical data.
As in philosophy, there is a strong cultural reward for parsimony in economics. The best thought experiments and the best models have the fewest parts or variables and explain the most. Again, there is tremendous power in getting the essential things right. What sociologists would typically claim is that if you get the one most essential thing right and lose the context, then the practical value of your understanding for the lived experiences of people may be low (see the quest for ever more esoteric instrumental variables).
What we have in the NLSY79 data is a quantitative description of all the employers and occupations in a person’s work history. The people in the NLSY79 longitudinal survey were born between 1957 and 1964. They were 14-22 when first interviewed in 1979 and were 55 to 62 in 2019 when our analysis ends. Our entry point in analyzing careers for this article was to look at a sample of hundreds of these work histories. The purpose of this investigation was to come up with the decision rules we used to determine whether workers changing employers and occupations remained in the same career. The two people’s work lives who are included in the article were selected not because they are typical or unusual, but because they are useful illustrations for explaining the decision rules.
In this post, I am taking a different tack. I think looking at these work histories is a useful for grounding our understanding of how people’s work lives unfold. The move is much like qualitative sociologists who interview 50 people and then highlight a few in an article. There is something to be learned by looking at the data even if they are not representative.
Before we go to the two people, the next two sections are a bit of an excursus. Occupations are at the center of the analysis for how we are describing work lives. As we discussed in part 1, occupations are the building blocks we are using to measure careers. But what is an occupation? It so happens that economists and sociologists think about occupations differently. What is perhaps more surprising is that neither approach maps on perfectly to how occupations become assigned in survey data like the NLSY79. If you are only interested in the descriptive stories, skip to the last section.
What is an occupation for economists?
From an economic perspective, an occupation is a bundle of tasks. For example, in the O*Net occupational database, we find that tasks are listed first. As we can see below in the example of Electricians, the description of the occupation is in terms of tasks (“install, maintain, and repair electrical wiring, equipment and fixture”) and the more detailed information starts with the tasks.

Tasks are associated with skills. Skills are the primary concept in human capital theory that dominates labor economics. The traditional general human capital model (the thought experiment and the econometric model), focused on years of education and years of work experience to predict earnings. More modern human capital models take into account task-specific human capital (see Gathmann and Schonberg 2010) by which they mean skills measured at the task-level as in O*Net.
Now to measure task-specific human capital, labor market researchers have to take a detour through the occupational codes because skill information at the job level is not available on the surveys. Instead, labor market surveys like the NLSY79 ask workers open-ended questions about the worker’s job title and their job tasks. These are then coded into the occupational classification system categories. Historically this coding was done manually by hand. I know there are efforts to use algorithms for the process, but I don’t know the current state of the practice (things move slowly and change is hard). For the NLSY79 historical data we will be looking at, most will have been done by hand. But economists don’t want the occupation code, they want the skills. To get there they use the occupation skill matrices from databases like O*Net and assign the person coded into the specific occupation the corresponding set of skills.
This is less than ideal operationalization. One step better for the task-specific human capital approach would be to ditch the occupational classification completely and use the job title and task information directly from the survey respondents. (If anybody from BLS is reading, I’d love to do this with the NLSY; get in touch if this data could be made available through a restricted-use environment). This information could then be coded into a skill matrix like the one used by O*Net (or with enough respondents like in the ACS or CPS used to create an empirical, rather than a priori tasks measures). Labor market researchers have started to do this using task data from job posting data, for example from Lightcast. An even better way to operationalize the task-specific human capital approach would be to ask respondents directly a more detailed set of questions about their job tasks and skills.
Both of these approaches would get around the problems of assuming that (1) occupations have a stable set of tasks that everyone in them performs and (2) that all workers assigned the same tasks have the same skills. Yet, those are the assumptions we are left with the current state the data. Job posting data has more detail about desired tasks and skills, but these are more like job descriptions and may be loosely coupled to what workers actually do in the job.
What is an occupation for sociologists?
The answer is multi-faceted. At the most basic level, the occupation code is reflecting the job at the employer. For sociologists studying firms and other organizations, job titles are important in how they reflect the position within the structure of the firm (see Tomaskovic-Devey and Avent-Holt’s 2018 book Relational Inequalities). A person’s position with the firm structure relates to decision-making processes, opportunities for positional mobility within the firm, and perhaps most important how tasks are distributed. The indications are that these practices can be highly firm-specific such that a same job title may only loosely correlate to the same role in different firm in the same industry. Team structures make position roles even more diffuse as the same person may have different roles on different teams. This is one reason to ignore job titles and to use task information when assigning occupations.
Going up a level, the most common understanding of occupations in sociology is as defining similar jobs at different employers and across different industries. This is a descriptive exercise that takes the whole labor market into account and this approach is reflected in how the occupational classification system works. The focus for sociologists in on tasks. Jobs have tasks, while workers have skills and the two are not reducible to one another. Occupations are understood as a meso-level unit of analysis with a set of shared tasks within the occupation. Yet, there is significant within occupation variation that can and should be studied.
Now the third and final view of what occupations are for sociologists is perhaps the real answer, but it also is the most difficult to operationalize. Occupations are groups of people organized around the right to perform certain tasks in the market (see Abbott 1988 The System of Professions). In this view, occupations are about power and the key concept is occupational closure (see Weeden 2002). The professions have the most occupational power and this is reflected in their ability to limit access to the performance of the job tasks. For example, through credentialing, unions, and licensure (think doctors and lawyers). What occupations do through associations, educational institutions, and other organizations is protect the boundaries of their tasks (e.g. the historical conflict over prescribing medication between medical doctors and nurse practitioners). Occupations also adapt to technological and institutional change by adapting their tasks and gaining or abandoning different spaces. To varying degrees, occupational power extends into firms. One of the main ways this occurs is through occupational internal labor markets, where occupations validate and legitimate the worker’s skills and experience in a job at one employer as connected to a job at another employer. Having an “outside option” or market for their specific skills provides a worker with greater negotiating power with employers.
The occupational closure perspective views all jobs as on a continuum from low closure to high closure. From this perspective, when we talk about home health aides, retail salespersons, machinists, and accountants we are talking about groups of jobs whose boundaries are unequally defined. This shows up in the unevenness of the occupational categories in occupational classification system which is created through a social process. Occupations with more social, cultural, and economic power have been able to care out narrower and more defined categories, while unorganized parts of the labor market are grouped into broad categories. At the very least, the occupational closure perspective urges caution when using occupational categories and the need to recognize how this unevenness may affect the analysis.
The U.S. lacks a large-scale employer-employee longitudinal dataset that is needed to situate worker’s jobs within firms and firm structures under the first approach. Progress is being made on this front by states, like my home state of Washington, in adding occupation codes to the unemployment insurance system data. This is a promising direction. At the federal-level survey data with occupation and other job details like Current Population Survey, the Survey of Income and Program Participation (4-year longitudinal panel), and the NLSY can be linked to unemployment insurance data through the Longitudinal Employer-Household Dynamics (LEHD) resulting in employer-employee datasets.
The second approach of thinking of occupations as tasks is closest to approach used by economists and the occupational classification system. Large scale data on tasks variation across employers and industries and change over time in tasks within the same occupation would further refine this model of occupations.
Studying occupational closure is more challenging. The occupational classification system isn’t designed to be dynamic. Yes, new occupations are added and others collapsed. Better data on tasks and additional data on the institutions associated with particular jobs would help operationalize closure. Another approach that builds on our conceptualization of occupational internal labor markets is to use flows within and between occupations to create measures of closure. One place occupational closure may show up in the data is when there are skill similarities between occupations, but we find few workers moving between these jobs. So, the absence of expected movement may reflect boundaries enforced by occupational groups.
Two Work Lives in the NLSY79
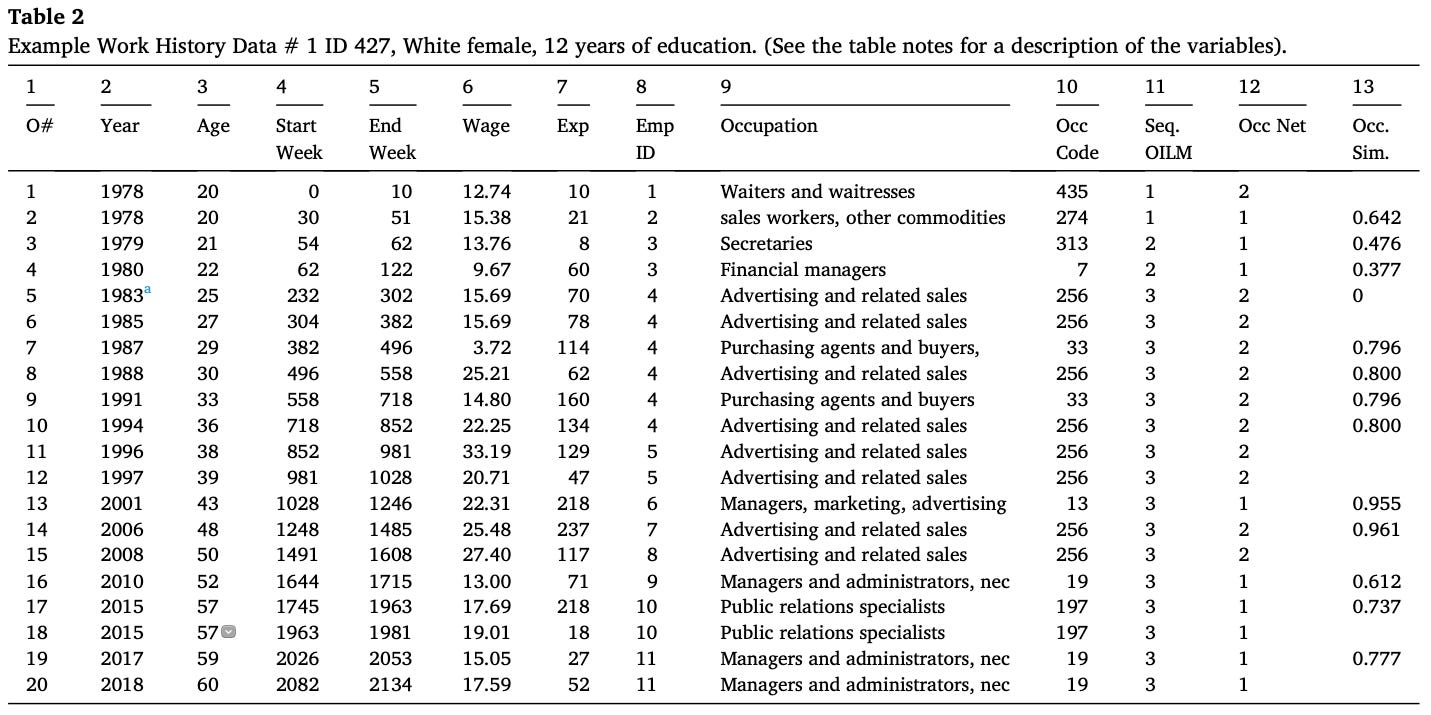
The two people’s work lives we illustrate in our article share similar demographic characteristics. They are both women with a high school diploma or equivalent education. Person 1 worked for 11 different employers over their work life, while Person 2 only worked for 2 (see EmpID column).
Person 1
Person 2
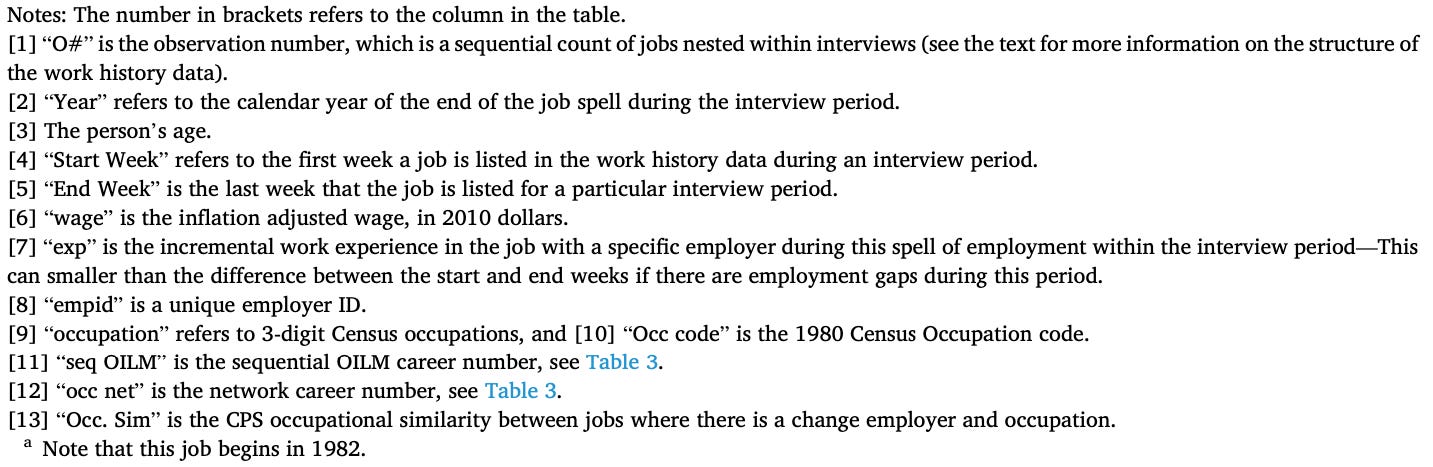
Person 1 had a break early in their work history between 1980 and 1982 from week 122 to week 232 and a couple breaks in their late 50s (compare week start and end dates for each observation). In contrast, Person 2 has a much more continuous work life. They have two spells when they weren’t working for 10 weeks each early in their career. Given that they returned to the same employer and their age, these could very likely be for parental leave. (The nature of these breaks is available in the NLSY, but not shown in these tables as it wasn’t the focus of the analysis. We have a follow-on paper on career discontinuities and childbirth that I will share on the blog in the future).
Person 1’s wages bounce around, while Person’s 2’s climb more steadily and stay high for longer. Wages are calculated by dividing earnings by hours worked. This makes them easier to compare across people who may be working a different number of hours. Wages penalize people who work long hours and gives a proportionate sense of what someone part-time might earn if they worked full-time. My first paper was about low-wage workers and I remember being surprised that physicians were showing up in my low-wage worker pool. I then realized these were likely interns making 60k but working more than 120 hours a week, which results in a low hourly wage.
The core of Person 1’s work history is when they entered the Advertising and Related Sales occupation at age 25 and remained it that job for most of the next 25 years for 3 different employers. Yet, there are two spells where they worked as a Purchasing Agent & Buyer with lower wages (age 29 and 33) both with the same employer. The wage differences seem to indicate these are different jobs, possibly commission based (which might explain the very low-wage in 1987). Even so the occupational similarity measure between Purchasing Agents & Buyers and Advertising and Related Sales is (.796 which is fairly high; the measure goes from 0 to 1; with .5 represents the average; the score is .8 in the other direction).
Outside of this period, Person 1 worked for lower wages in their first jobs and in their jobs after 2010. They have a break in their work history in 2009 for 36 weeks which corresponds to the Great Recession, which is validated by the wage drop ($27.40 to $13.00). In contrast, to a view of steady wage growth due to gaining experience, Person’s 1 work history speaks to moving into a better paying occupation and staying there.
Person’s 2’s wage climb is much steadier, which likely reflects staying at the same employer and experiencing regular wage increases from performance appraisals. Their starting wage went from $8.98 at age 18 to a peak of #25.21 at age 28; a threefold increase in 3-years. Person 2’s work life exactly fits the stylized fact that most wage gains occur in the first 10 years in the labor market.
Over this period their job is classified into 8 different occupations. They work in manufacturing where the occupational codes are more finely grained given the historical importance of manufacturing to the U.S. economy, the industry’s historically high unionization rates, and the corresponding interest in detailed data. Even so, Person 2 ends up in one “Miscellaneous” occupation category for 3 years a n.e.c. (not elsewhere classified) for 1 year. These types of categories are the “catch all” of the occupational classification system and seems to indicate the codes aren’t perfect fits. There is a question of how much different a “Miscellaneous machine operator” is from an “Assembler” (occupational similarity score of .863) in the context of this person’s career. What does seem clear is a general upward climb from operator to technician over this period.
Person 2 then makes a lateral move to a new employer taking a pay cut in 1990. They experience an 18-week employment break at age 28. This could reflect a layoff or childbirth. More investigation would be needed. Person 2 starts the same job at a new employer and then within 3 years shifts from being a Technician to Data-Entry and then to being an Editor. For our sequential OILM measure of careers, this is a continuous career because it with the same employer. The occupational network approach separates sequence into two careers differentiating between the technical career and the data-entry/editor career. Person 2 hits their highest wage an editor in 2002 at $33.36 an hour. They then finish their work life as a Production Inspector and were still working when we end our analysis in 2019.
What can we learn from studying these two work lives? For Person 2, employer stability appears to be the hallmark. They looked to have moved along a firm internal labor market across different occupations within the employer. When the shifted employers after a break, they stayed in the same occupation and continued climbing. Firm internal labor markets are thought to be less common today. Yet, there are few empirical analyses of this nature to confirm that and the data using firm tenure measures are pretty equivocal.
Person 1’s work life does not fit the narrative as easily. They experienced more employment breaks and were negatively affected by the Great Recession. They had to shift occupations from the advertising job where they had earned the highest wages and had the most stability. They ended their work life as a manager, but not earning high wages. Their work life is more boom or bust.
Looking descriptively at these two work lives, we can see that there might be error in the measurement of occupation and there is certainly evidence of variation (not all managers are high paid). However, the longitudinal nature of the data and multiple data points helps us make sense of what these people’s careers looked like. In cross-sectional data, we don’t have the advantage.
These are only two people. It would be a valuable research project to apply qualitative methods to the study of 100s of work histories in the NLSY79. If this story is in the variation, we might uncover patterns we don’t know to look for when we move onto modeling wages and experience and measuring whole careers.